Trading Analysis
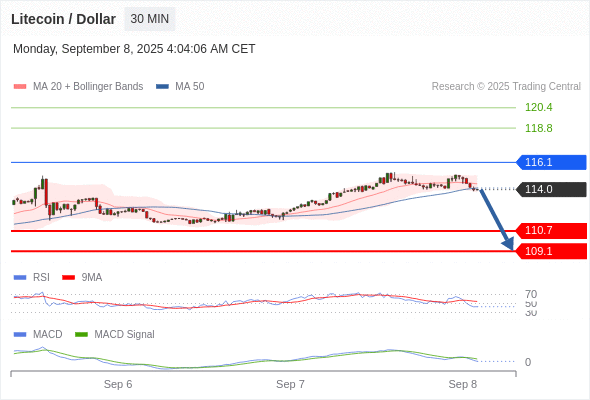
Litecoin
IntradayLitecoin Intraday: under pressure below 116.1
Our preference: under pressure below 116.1.
the RSI is below its neutrality area at 50. The MACD is positive and below its signal line. The MACD must penetrate its zero line to expect further downside. Moreover, the price stands below its 20 and 50 period moving average (respectively at 114.4 and 114.1).
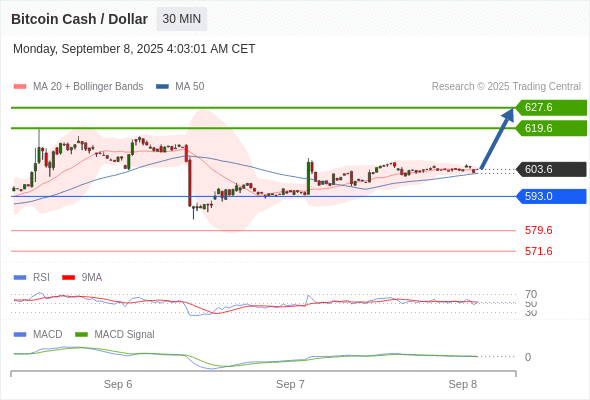
Bitcoin Cash
IntradayBitcoin Cash Intraday: as long as 593 is support look for 627.6
Our preference: as long as 593 is support look for 627.6.
the RSI is above its neutrality area at 50. The MACD is below its signal line and positive. The price could retrace. Moreover, the price is trading above both its 20 and 50 period moving average (respectively at 603.5 and 602).
USD/CAD
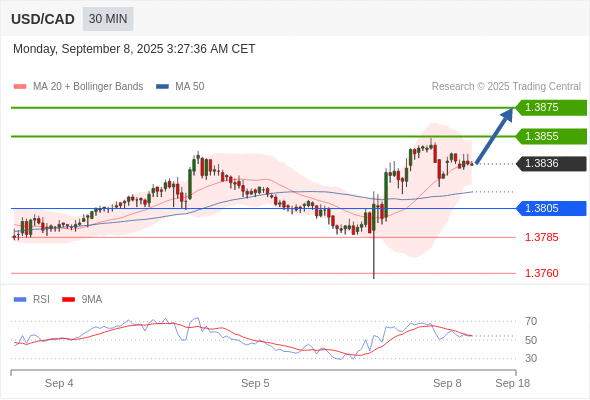
IntradayUSD/CAD Intraday: bullish bias above 1.3805.
Long positions above 1.3805 with targets at 1.3855 & 1.3875 in extension.
the RSI lacks downward momentum.
USD/JPY
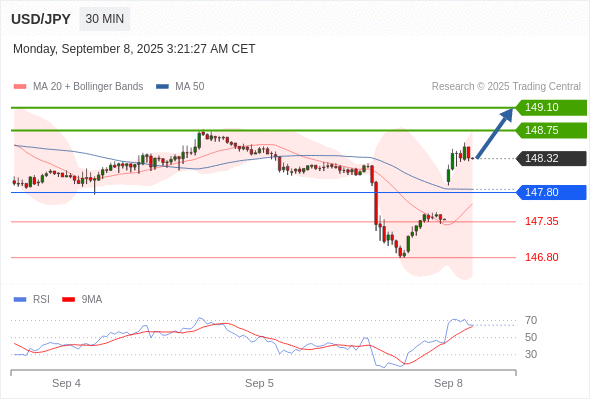
IntradayUSD/JPY Intraday: bullish bias above 147.80.
Long positions above 147.80 with targets at 148.75 & 149.10 in extension.
the RSI advocates for further upside.
Brent
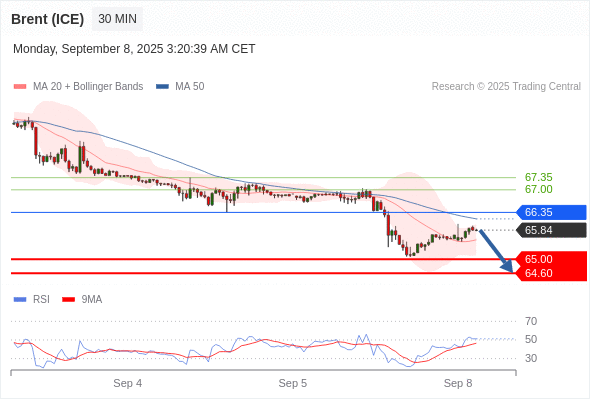
IntradayBrent Intraday: key resistance at 66.35.
Short positions below 66.35 with targets at 65.00 & 64.60 in extension.
as long as the resistance at 66.35 is not surpassed, the risk of the break below 65.00 remains high.
Ethereum
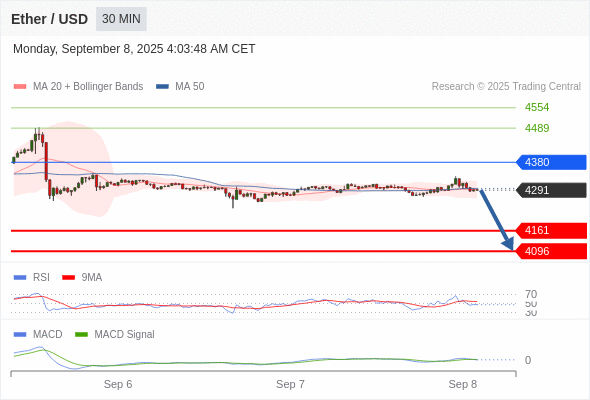
IntradayEthereum Intraday: under pressure below 4380
The MACD must penetrate its zero line to expect further downside.
the RSI is below 50. The MACD is positive and below its signal line. The MACD must penetrate its zero line to expect further downside. Moreover, the price is trading under both its 20 and 50 period moving average (respectively at 4293 and 4296).
Bitcoin
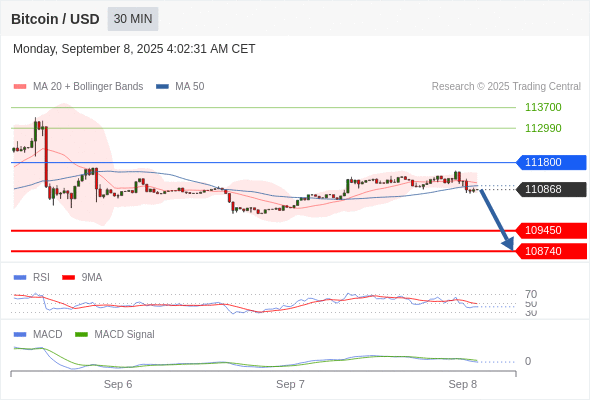
IntradayBitcoin Intraday: the downside prevails as long as 111800 is resistance
Our preference: the downside prevails as long as 111800 is resistance.
the RSI is below its neutrality area at 50. The MACD is below its signal line and negative. The configuration is negative. Moreover, the price stands below its 20 and 50 period moving average (respectively at 111103 and 111002).
AUD/USD
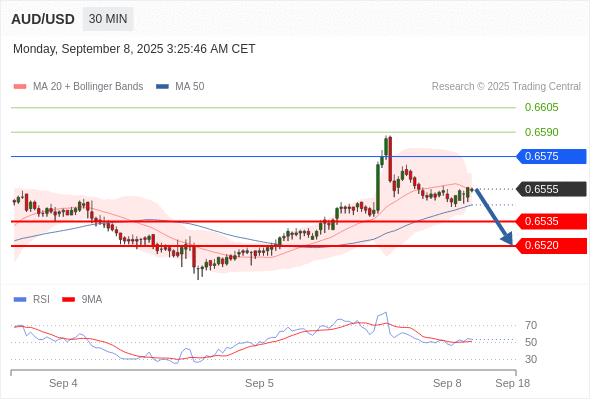
IntradayAUD/USD Intraday: under pressure.
Short positions below 0.6575 with targets at 0.6535 & 0.6520 in extension.
as long as 0.6575 is resistance, look for choppy price action with a bearish bias.
Natural Gas
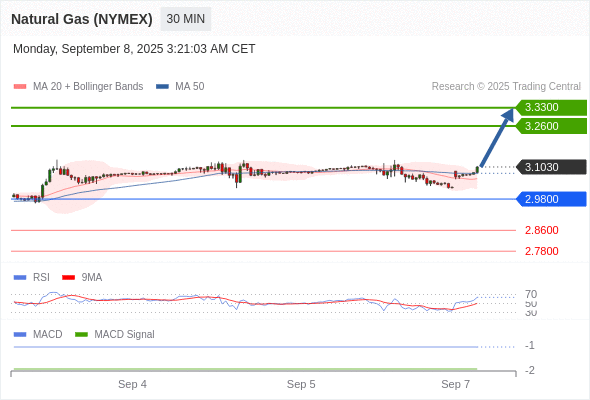
IntradayNatural Gas Intraday: above its upper Bollinger band
The MACD must break above its zero level to trigger further gains.
the RSI is above 50. The MACD is negative and above its signal line. The MACD must break above its zero level to trigger further gains. Natural Gas (NYMEX) (OCT5) is trading above both its 20 and 50 period moving average (respectively at 3.0580 and 3.0790). Finally, the Natural Gas (NYMEX) (OCT5) is trading above its upper Bollinger band (standing at 3.1000).
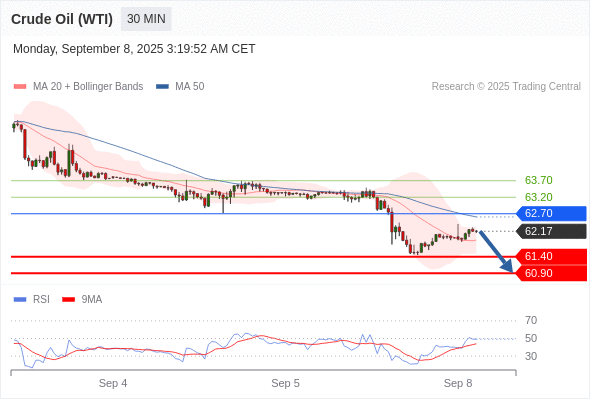
WTI
IntradayWTI Intraday: key resistance at 62.70.
Short positions below 62.70 with targets at 61.40 & 60.90 in extension.
as long as the resistance at 62.70 is not surpassed, the risk of the break below 61.40 remains high.
